
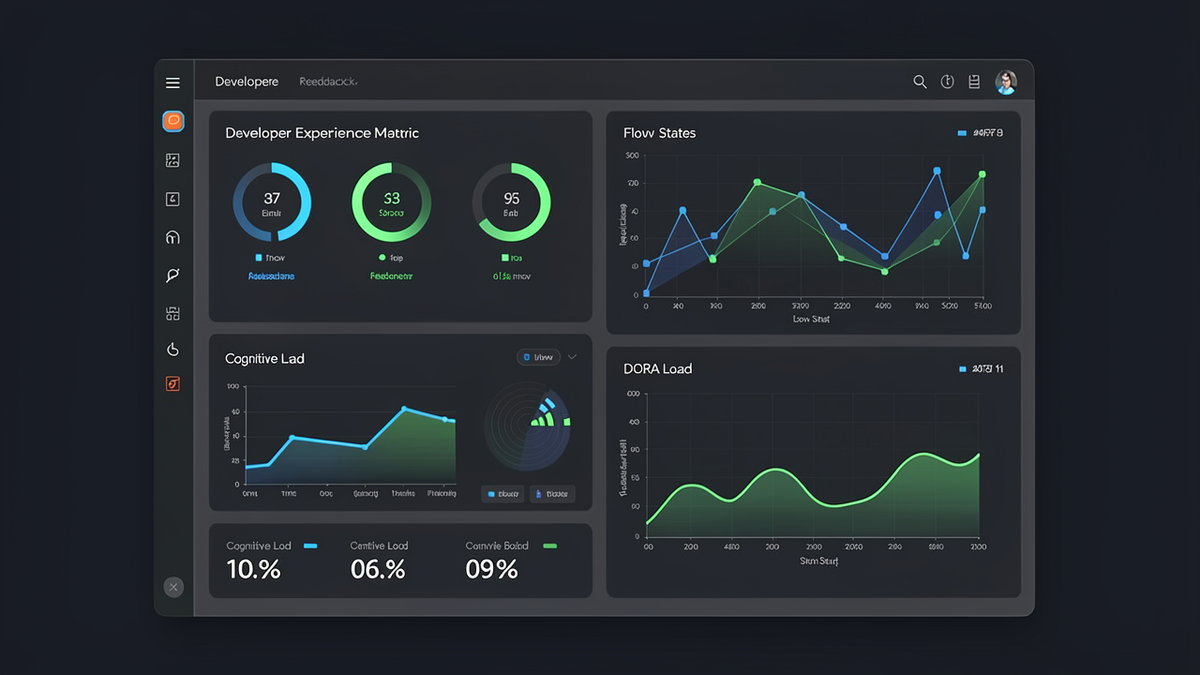
Moving Beyond DORA: Developer Experience Metrics That Actually Matter in 2026
For years, DORA metrics — deployment frequency, lead time for changes, change failure rate, and time to restore service — have been the gold standard for measuring engineering performance. They were revolutionary when they arrived, giving teams a data-driven way to talk about software delivery. But in 2026, as AI-augmented development and platform engineering have matured, relying solely on DORA is like judging a novel by its word count. You are measuring output, not experience. And experience is what drives sustainable velocity.
The DORA Trap
DORA metrics were never meant to be the end state of engineering measurement. They were designed as leading indicators correlating with business outcomes. The problem emerged when organizations treated them as goals, creating perverse incentives: teams optimized deployment frequency by splitting changes into smaller, less valuable chunks. Lead time was gamed by reducing scope. Change failure rate became a numbers game rather than a quality signal. Researchers now call this "DORA theater" — looking good on dashboards while actual developer productivity stagnates.
A 2026 study by the State of DevOps research group found that 68% of engineering leaders reporting "excellent" DORA scores also had developer satisfaction scores below 60%. The metrics told one story while lived experience told another. This disconnect is why the DevEx movement has gained such momentum.
The Three Pillars of DevEx Measurement
Modern DevEx measurement rests on three dimensions that go deeper than DORA: feedback loops, cognitive load, and flow state.
Feedback loops measure how quickly developers receive meaningful responses to their work. This includes code review turnaround, CI/CD pipeline feedback, and the quality of review comments. A 15-minute review with actionable feedback is worth more than a 2-hour review with a perfunctory "LGTM."
Cognitive load is the most neglected dimension. It measures the mental effort required to accomplish tasks. High cognitive load comes from unclear requirements, complex build systems, opaque deployment processes, and tool context switching. The best teams track it through developer surveys combined with workflow analysis, identifying friction points that no deployment metric would reveal.
Flow state measures uninterrupted productive time. This is the antithesis of the modern developer experience, where notifications and meetings fragment the workday. Flow state can be measured indirectly through calendar density, notification frequency, and self-reported deep work hours. Teams that protect flow time consistently outperform those that do not, regardless of DORA scores.
Practical Metrics That Replace DORA Theater
Here is a pragmatic set of DevEx indicators that have proven their worth across high-performing organizations in 2026:
- Onboarding time to first commit: How long from day one to meaningful code contribution? Top quartile teams achieve this in under two weeks, capturing documentation quality, environment setup, and mentorship effectiveness.
- Mean time to meaningful feedback: Not just code review time, but the time from "I need help" to "here is a useful answer" across Slack, GitHub, and internal documentation.
- Developer satisfaction index: A quarterly pulse survey measuring three questions: Do you have the tools you need? Do you understand what to work on next? Do you feel your time is used well? Average these for a single index score.
- Context switch frequency: How many times per day a developer switches between distinct work modes. High-frequency switchers show 40% lower output quality.
- Build and pipeline reliability: Percentage of CI/CD runs completing without manual intervention. Flaky pipelines are a major source of cognitive load.
- Incident response satisfaction: Not just MTTR, but how the on-call engineer experiences the incident. Fast resolution with a traumatic process is worse than slower resolution with a well-run war room.
The Developer Experience Index
The most sophisticated organizations in 2026 are moving toward a composite Developer Experience Index that combines survey data with engineering metrics. Platforms like Jellyfish and custom internal tools aggregate feedback loop quality, cognitive load signals, and flow state preservation into a single score. No single metric tells the whole story — the index approach forces you to consider tradeoffs.
For example, you might see DORA metrics improve while the DevEx Index drops. This could mean deployments are faster because teams are shipping smaller, less impactful changes, or that automation has reduced human involvement to the point where developers feel disconnected. The index makes these tensions visible.
Implementation: Start Small, Measure Consistently
Transitioning from DORA-only to DevEx-aware measurement does not require a platform overhaul. Start with developer satisfaction surveys — they are cheap, fast, and surprisingly predictive. Add one workflow metric that matters to your team, such as onboarding time or context switch frequency. Share the results transparently with engineering, and act on the findings.
The teams that get this right share their DevEx metrics publicly, treat them with the same seriousness as DORA, and iterate on improvements with the same rigor. In 2026, the best engineering organizations are not just shipping faster — they are making sure the people shipping the software actually enjoy the process.
DORA metrics told us how fast software flows through the pipeline. DevEx metrics tell us whether the humans in the pipeline are thriving. Both matter. But only one predicts long-term sustainability.
Comments